Beginners guide to Alphacast
Alphacast is an integrated platform for economic and financial analysis.
Our goal is to help you use your time wisely. Stop spending your day copying & pasting data from sources that frequently change their formats, or updating charts. Keep your files, scripts, and charts always up to date. Have all the data and charts you need in a single place and discover new data and ideas from the community.
There are many things you and your team can do with Alphacast. Download and create data or dashboards, integrate with R or Python or Power-bi, create interactive charts o maps or transform the data with pipelines.
but let's start from the beginning
Downloading your first dataset
Let's start by finding some data you need, say, for example. Argentina's Consumer Price Index.
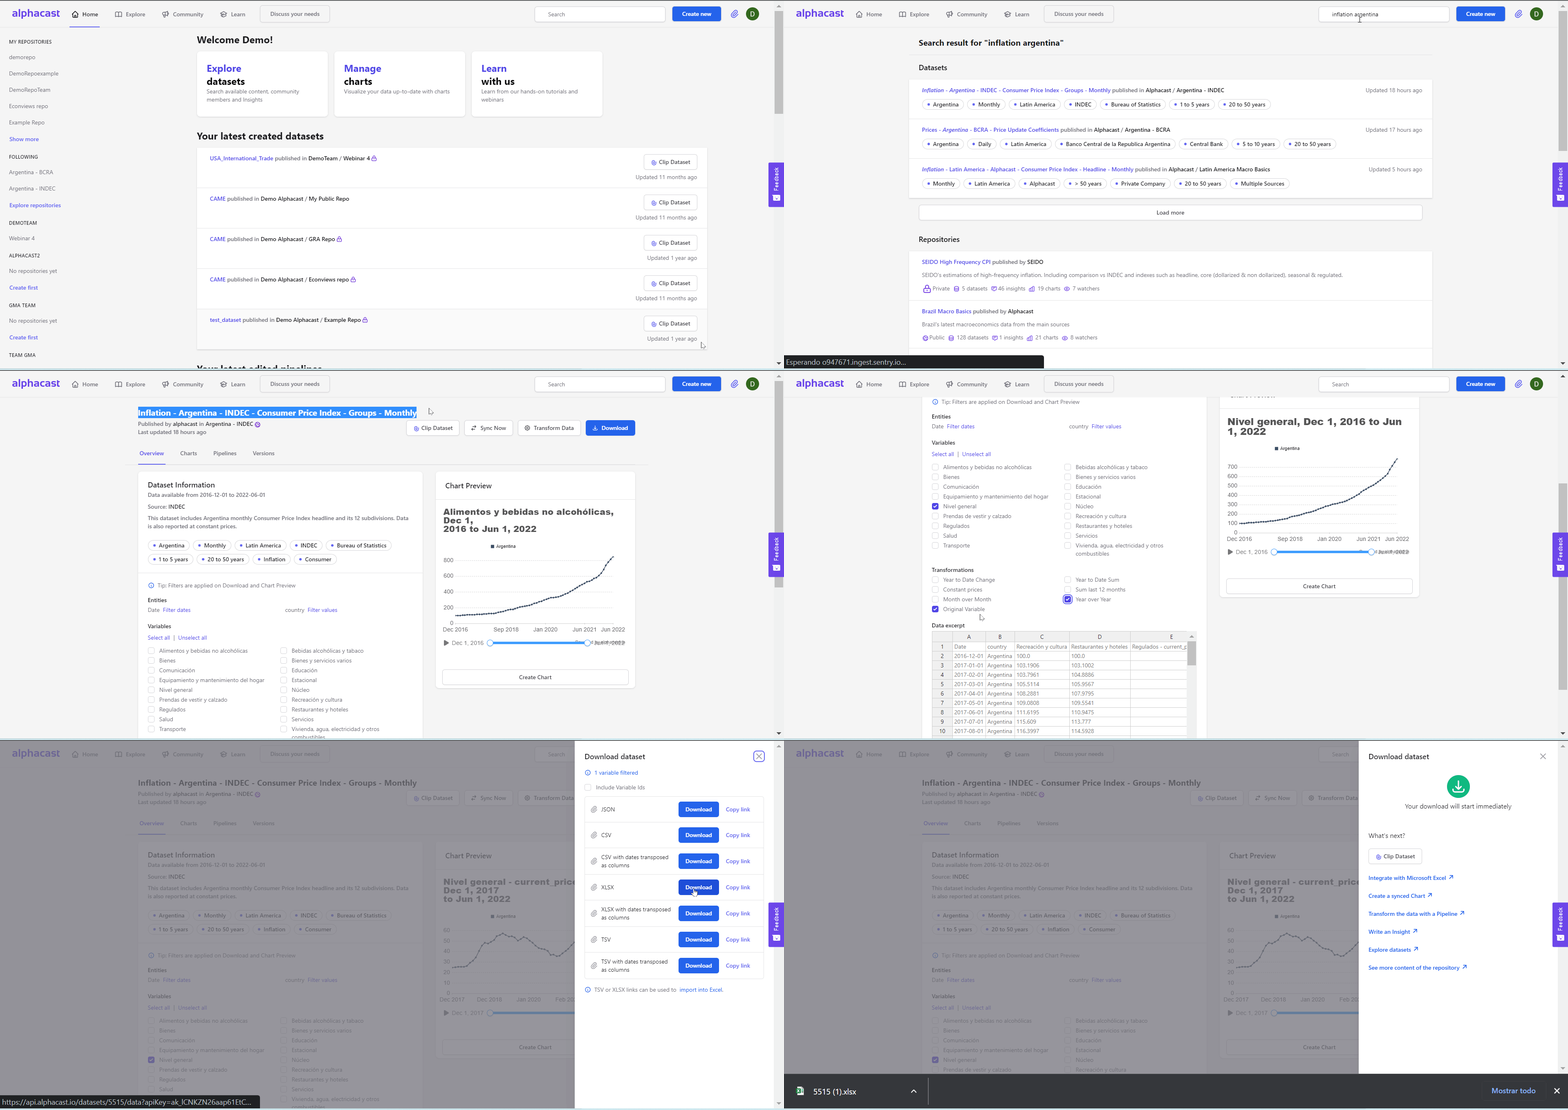
- Go to Search at the top right of your screen. Type "Inflation Argentina", search and select any dataset, for example "Inflation - Argentina - INDEC - Consumer Price Index - Groups - Monthly"
- Filter the data that you need. You can filter variables, entities and, in some datasets, also pre-defined transformations. You will see how the preview on the right bar changes (if you want to get adventurous, click "Create chart" and head to the chart creator).
- Click Download on the top right - You should be logged in to do this - and select the format you want. That's it. The Browser will start downloading your dataset.

Connecting the data to Excel
To have this data always connected to Excel you have to follow two simple steps:
**(1) Getting CSV/XLS download links from the Dataset. ** Click again on download but instead of clicking download, click on "copy link" on either CSV or XLSX (2). Now go to Excel, select Get Data -> From Other Sources -> From Web, and enter the URL you copied from the Alphacast website.
This simple video describes how to do it:
More content:
- How to use Alphacast Python Library?
- How to integrate Alphacast with Google Sheets?
- How to download data with the API?
- How to connect to STATA or Power BI?
- How can I create a new Dataset?
- Where do I find Alphacast open-source code?.
Creating your first dashboard
Dashboards are a great way to monitor data that you have to see frequently. See some examples of dashboards here, here, or here.
Step 1. Clipping charts
The easiest way to build a dashboard is by preselecting charts you like, either yours or those you find in the community. This is done by "clipping" charts, and adding them to the clipboard (Access it via the hook button at the top right of the screen). Click on the clip chart below any graphic and voila, it is already saved in the clipboard.
Dashboard --> clipping charts

Step 2. Adding Chart to dashboard
To create and publish a dashboard, find and click the button in the upper right of the site "Create New" and select "Insight". The window on the left is the editor. There you can add a title, subtitles, and all the charts you want to visualize on your dashboard.
To begin adding charts delete everything on the editor
Once you have already clipped all the charts you are interested in, it is time to add them to your dashboard! To do this, you have to click on the clipboard button and drag the charts to the left one by one. It's not important to keep the order since later you can order them as you want!

Step 3. Sorting, rescaling, and publishing.
Then click on switch to dashboard view to see what your dashboard would look like
you can change the order of the charts by dragging them from one position to another and you can also resize them from the bottom right corner of each chart to have a better view of your dashboard as seen below

Creating your first chart
Now let's create your first chart. There are two ways to create a chart:
-
From scratch: click Create new on the upper right corner and then Chart. You will be redirected to the pipeline. Select Fetch Dataset Alphacast and Select Datasets. Type the name of the dataset and select it. filter "Nivel Gerneral" variable. Select the step "Create a chart" on the left. Select the variable and click save.
-
From any dataset: you can create a chart from any dataset. If you are still on the dataset Inflation - Argentina - INDEC - Consumer Price Index - Groups - Monthly filter again the variable "Nivel General" and its transformation "Year over Year". When doing so, in the upper right you will see the Chart Preview. Then click on Create chart. It will redirect you to the pipeline, follow the next steps to finish your chart.

Once you are editing your chart you can add other variables or change the chart type by clicking the top right blue button. There you can choose variables from the dataset you are working on or from others. Following our example we add two more variables from the same dataset and then we click on Save button. You can also customize the chart as you wish by selecting the different tabs on the right side of the chart editor.

Finally, click on Save. That's it! You have just created your first chart. It is saved in the pipeline and you can modify it whenever you want. You can access it with its link (click on the title of the chart)
Transforming data with pipelines
With pipelines, you can process the data within the platform. A pipeline is a sequence of steps, transformations and others to be applied to a particular dataset that has the characteristic of updating automatically every time a data is updated. There are two different ways to do this:
- From scratch: click Create new on the upper right corner and then Pipeline.
- From any dataset: you can create a pipeline from any dataset. When entering to the dataset view, on the right you will find the button Transform Data Both options will lead you to the Pipeline Engine.
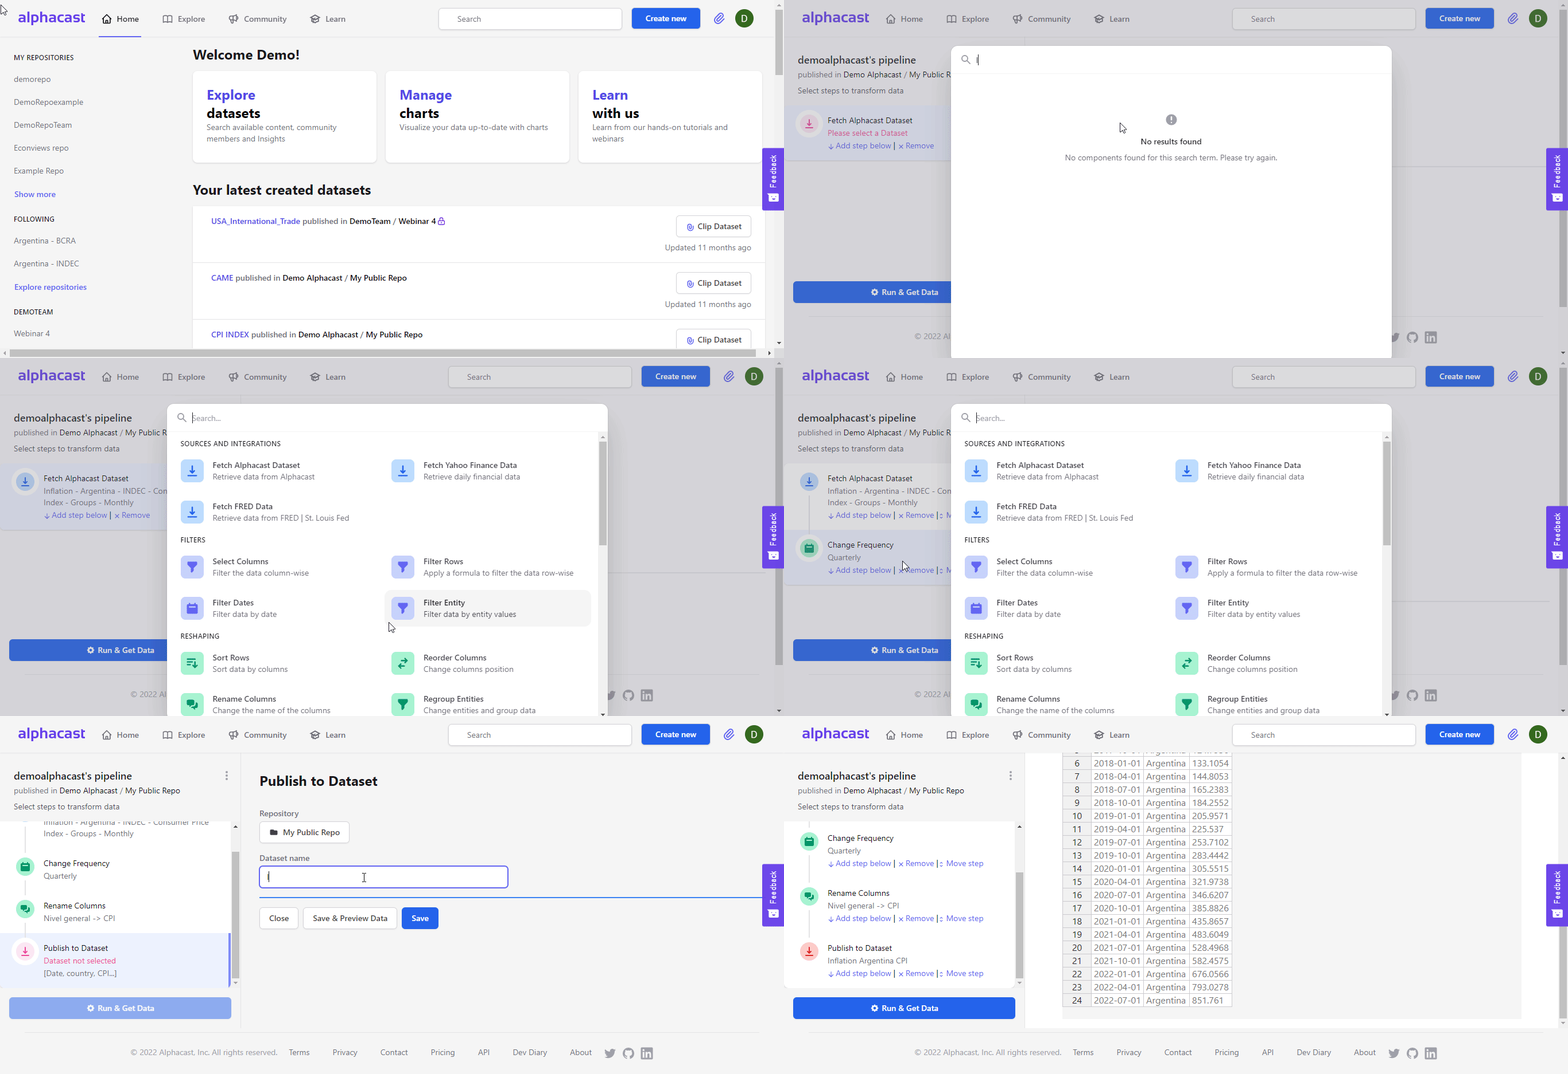
Here you will need to choose the repository where the pipeline will be stored and select a name for it. After that is where the fun begins!
First, you will have to choose the data you want to work with it could be fretch form: An Alphacast Dataset, FRED or Yahoo Finance. Once you save it, you will be able to choose different steps to modify and transform your data as you wish.
As an example, we chose the following dataset: Inflation - Argentina - INDEC - Consumer Price Index - Groups - Monthly and we applied the following steps:
- Select columns: to leave only the variable we were interested in and leave behind the other ones.
- Rename columns: to change the name of one of the variables
- Change Frequency: to rescale the frequency from monthly to quarterly
Once you finish working with the transformations you want to apply to your dataset, you can choose which output works for you: Publish Dataset, Create a Chart, Data Snapshot, or Add Markdown text.
Remember to click the Save button each time you finish working on your step.

